BH Curves for Neodymium Magnets
Graphs and info about demagnetization (BH) curves and hysteresis loops
What is a BH curve?
A BH curve, also known as a demagnetization curve, describes the magnetic qualities of a magnet more completely than a single number like Pull Force or Surface Field. It provides information about the strength of the magnet, how hard it is to demagnetize, and how a magnet's shape (or use in a magnetic circuit) affects matters.
Where does BH curve data come from?
A BH Curve describes the magnetic properties of the magnetic material. Let’s examine one step by step.
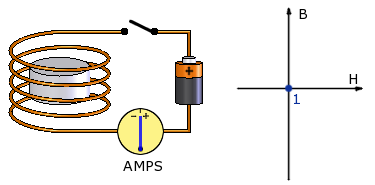
Consider a neodymium magnet sitting inside a magnetizer. The magnetizer is essentially a coil of wire wrapped around the magnet, through which we will apply a very strong current to create a magnetic field.
In the graph at right, the horizontal axis shows the strength of the Applied magnetic field (H) – the one we get by running current through the wire. The vertical axis shows the Induced field (B), which the permanent magnet creates by itself.
The magnet we will start with has just been manufactured, but not yet magnetized. The magnetic field it creates is zero (B). There is no current running through the wire, so the applied field (H) is also zero. Let’s represent this point with a dot at the zero location on the graph, point #1.
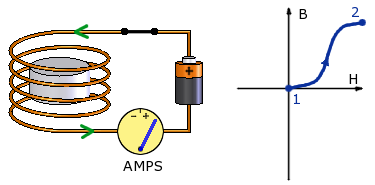
Now, let’s briefly run a terrifically strong current through the wire, placing the magnet in a uniform magnetic field. Keep increasing the current, and the applied field increases. If we measure the magnetic field, we also see an induced magnetic field, made from the magnet.
At point #2, the increases level off. At point #2, we still have a current running through the wire producing an Applied field, plus an Induced field from the magnet.
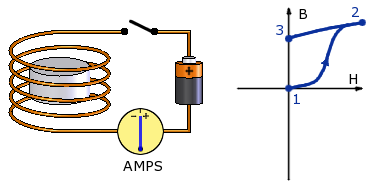
Now, let’s turn the current off. The Applied field (H) drops to zero, but there remains a magnetic field produced by the magnet, shown as point #3. This point is also called Br, Br max, the Residual Induction or the Residual Flux Density.
In our Glossary, we define Br as, “the magnetic induction remaining in a saturated magnetic material after the magnetizing field has been removed.” That's at point #3.
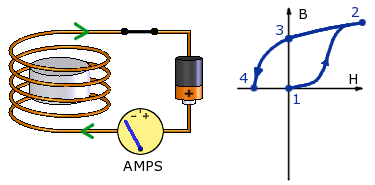
If we apply a current in the opposite direction, the magnetic field created by the current in the coil of wire opposes the field from the magnet -- it is in the opposite direction.
By applying progressively more current in this direction, we can find the shape of the normal curve in the second quadrant (the upper left hand quarter) of the BH Curve graph. Where the Induced field reaches zero, at point #4, is called the Coercive force, Hc. This is the magnet's Coercivity: the measure of the magnet’s resistance to demagnetization by an external magnetic field.
The farther left on the graph this point is located, the stronger the magnetic field you need to demagnetize the magnet. Not only are neodymium magnets strong, but they have the highest coercivity values of all permanent magnet types.
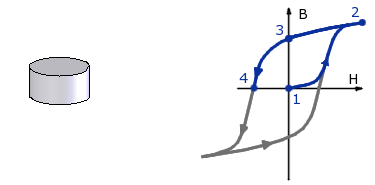
The rest of the graph follows a symmetric form. The whole shape of this graph is the hysteresis curve, and defines how a particular magnet material behaves. It is a property of the magnet material.
When considering the performance of an already magnetized magnet in an application, we only need to look at the 2nd quadrant (the upper left quarter of the graph) to see how it will behave.
The shape of the curve shows how the magnet works in actual applications. The actual operating point on the graph depends on the shape of the magnet and how it is used in a magnetic circuit (its Permeance Coefficient). For some examples of how to use this information and to find the actual operating point on this curve, see our article on Temperature and Neodymium Magnets.
Parts of a demagnetization bh curve
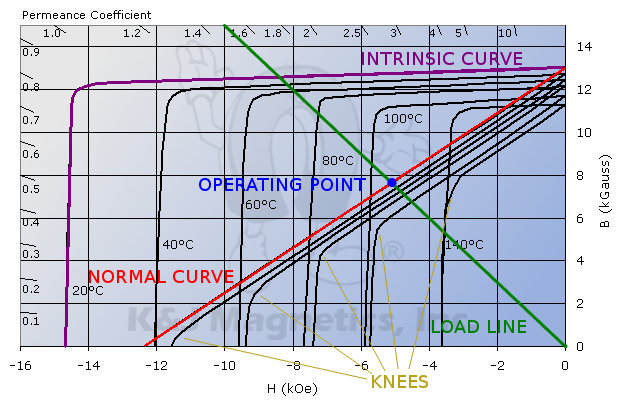
Now let's focus in on that second quadrant of the hysteresis curves, zooming in on just the upper left section. Let's define a few of the interesting features of these curves.
Normal Curve: This curve describes the magnet's performance. Use the curve for the desired operating temperature. It's the curve most referred to for design purposes.
The Knee: The part of the Normal Curve where it bends down, becoming a vertical line.
Intrinsic Curve: The intrinsic curve describes the properties of the magnet if it had no air gap between the poles. Don't worry about this curve for now.
Load Line: A line from the origin, with a slope equal to the Permeance Coefficient of the magnet in circuit. It's also called the Operating Line. Draw this line from zero to the Permeance Coefficient of your magnet shown around the edges of the graph.
Operating point: The intersection of the Load Line and the Normal Curve describes the single operating point of a magnet.
How do axes of these graphs relate to performance I can feel or measure?
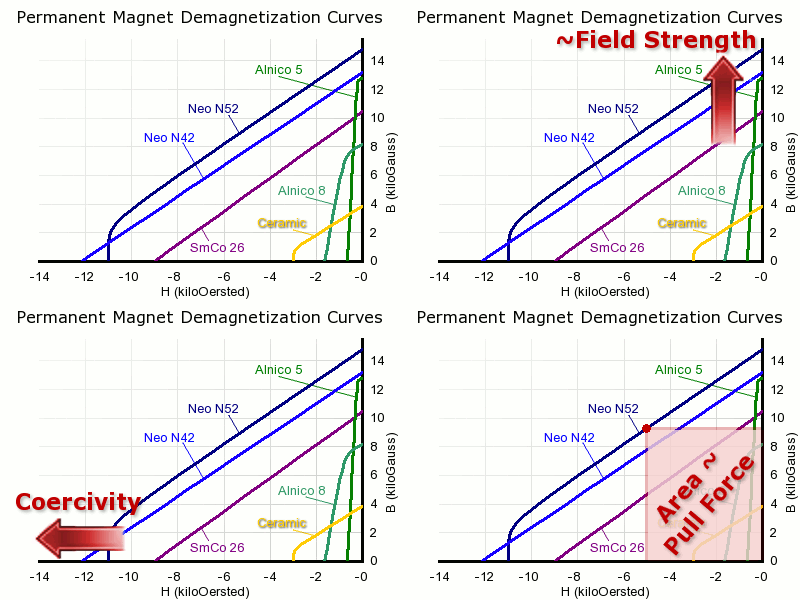
There are several interesting measures of a magnet’s strength. A glance at the shape of a demagnetization curve tells us about the field strength, coercivity and pull force we expect from a magnet made with this material.
Field Strength: Loosely speaking, where the curve hits the vertical axis of this graph tells us about the maximum field strength we can expect from it. You can't find Surface Field directly, though.
Coercivity: The coercive force required to demagnetize a magnet. The bigger this number is, the harder it is to demagnetize.
Pull Force: Draw the largest box you can where one corner intersects the origin, and the opposite corner sits on the normal line. The area of this box is the Maximum Energy Product, or B x H. This number is directly related to pull force. It's also how neodymium magnet grades are named; an N52 magnet has a B x H of 52 MGOe.
Who uses BH curves?
If you just want some Magnetic Thumbtacks to stick to the fridge, you don't need to worry about these curves. Just use listed pull force numbers to compare the strength of various magnets.
When should you be concerned with these curves? While neodymium magnets are hard to demagnetize, it can be done. The most common cause of demagnetization is high temperatures. Our in-depth article about Temperature and Neodymium Magnets uses BH Curves extensively to answer questions about how a magnet might perform at various temperatures.
If you're an engineer who designs electric motors using magnets, you probably use these curves extensively. A magnet in a motor can be subjected to both higher temperatures and externally applied magnetic fields. These curves are used to predict a magnet's performance.
